Your Dashboard is an overview of your business. This is the first thing that you will see when you log into the system.
It will outline the progress and performance of your business. Here are the potential different parts of your default Dashboard.
Dashboard Data Tiles
Your dashboard is made up of many different pieces of data that give you a 10,000 ft view of your activities and success in your CRM! Below are the different data tiles that you will see, and what they are used for:
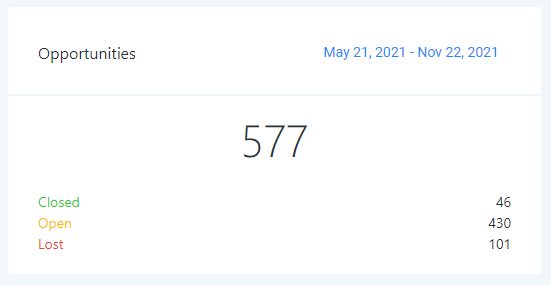
Opportunities
Number of Leads in your Pipeline.
Pipeline Value
All of your Leads’ total worth.

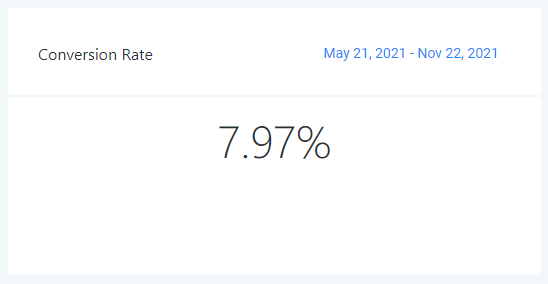
Conversion Rate
Percentage of your ‘WON’ Leads/Accounts.
Funnel
A visual representation of what stages your Opportunities are within your Pipeline.

Stages Distribution
This is a cyclic graph of your Pipeline.

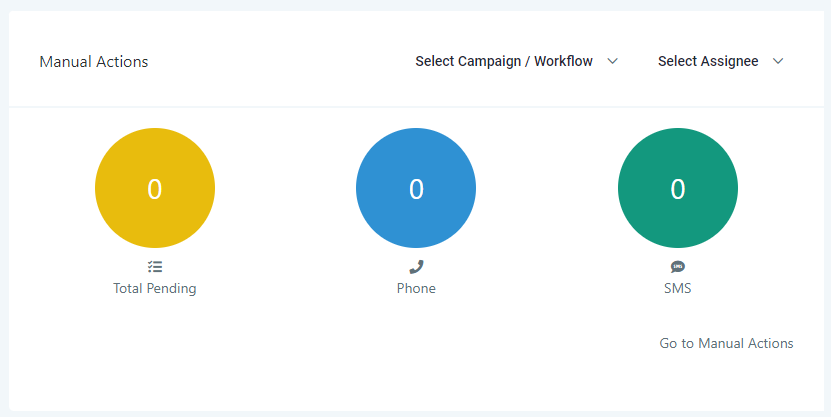
Manual Actions
An overview of all your manual actions.
Tasks
</