Table of Contents
More Tutorials From the Community
https://youtu.be/PYIzk0P8aLQ?si=NIQZQpJSWwYUc3Ky
Effortlessly tailor your reporting experience by creating and managing multiple dashboards, ensuring they cater to your unique needs and insights. Streamline your data visualization by organizing related widgets into a unified view using our dashboard feature.
TABLE OF CONTENTS
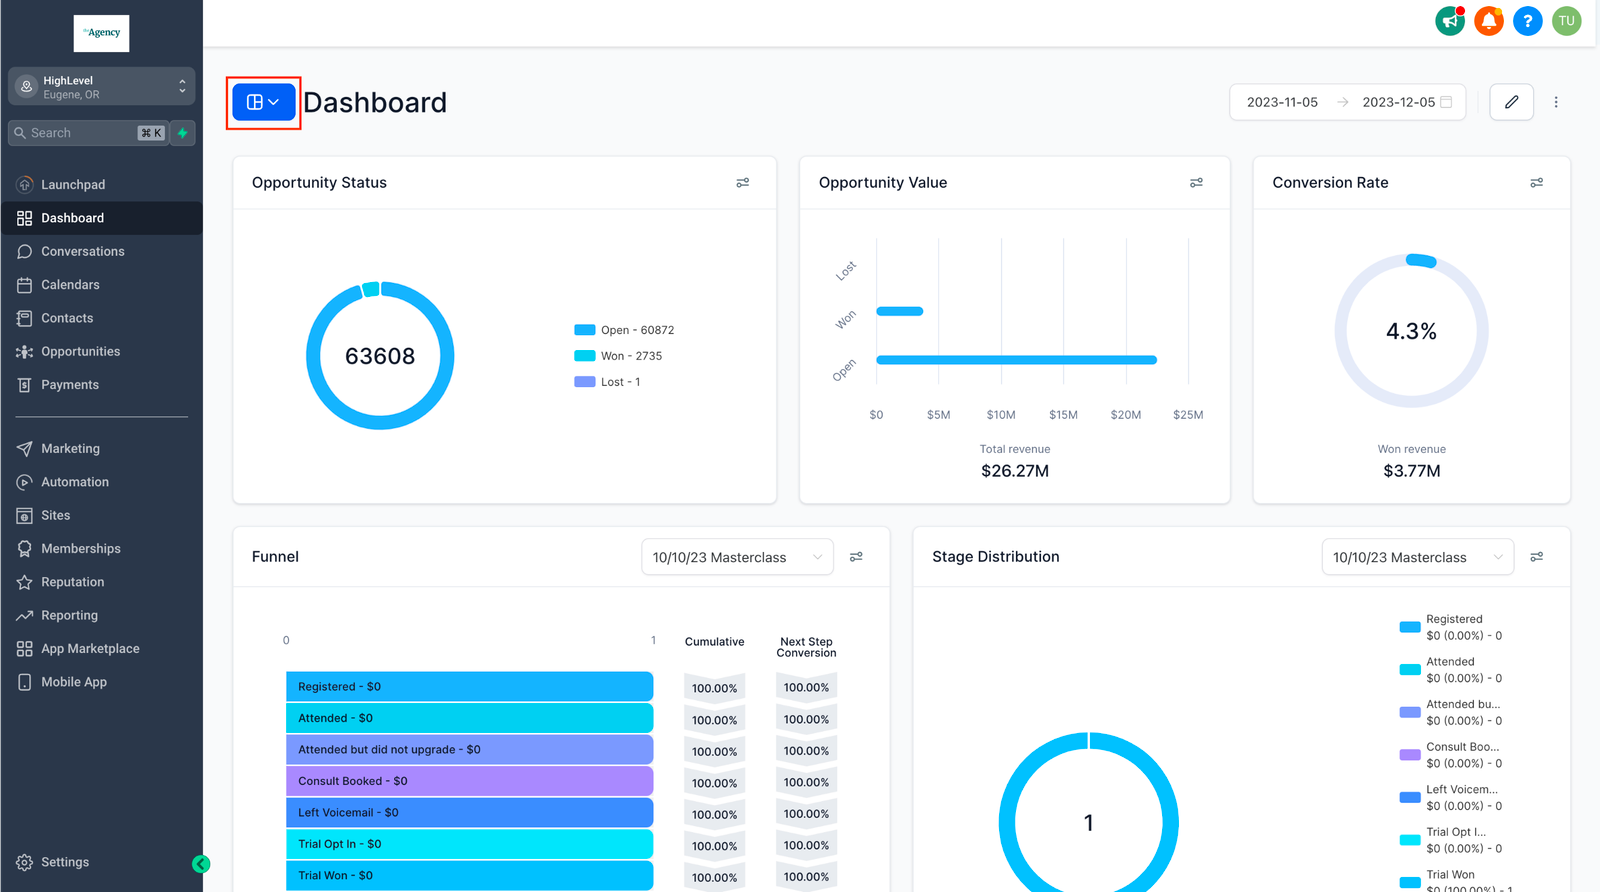
Step 1: Navigate to Dashboards Menu
-
Click on the blue dashboard navigation button, found on the left side of your screen.
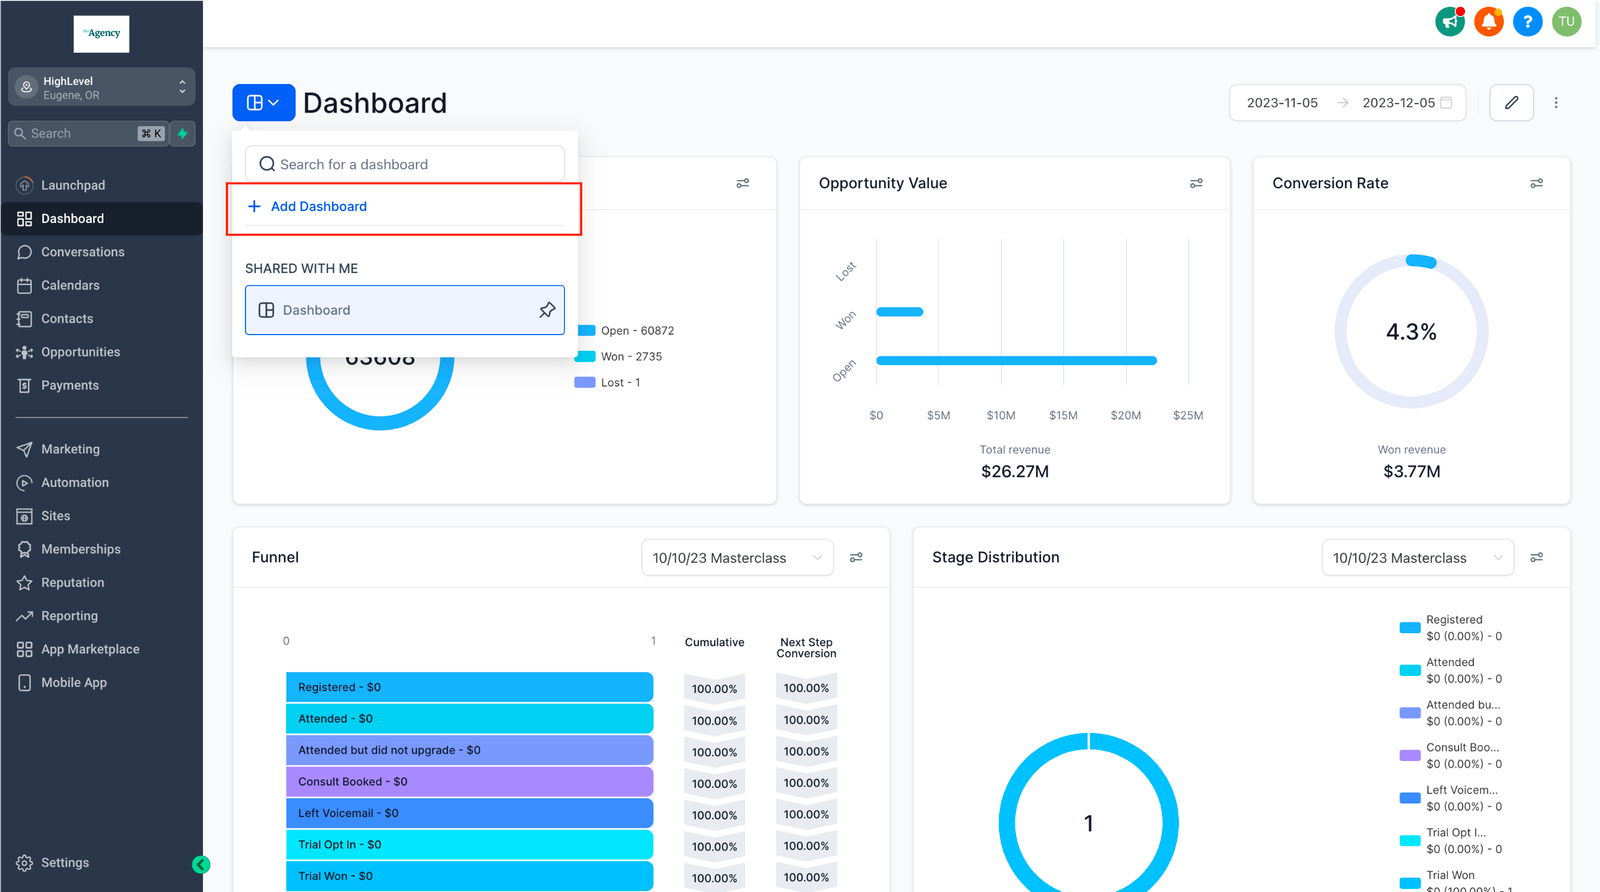
Step 2: Click on “Add Dashboard”
Step 3: Assign a Title
-
Give your dashboard a clear and descriptive title that aligns with its reporting purpose.
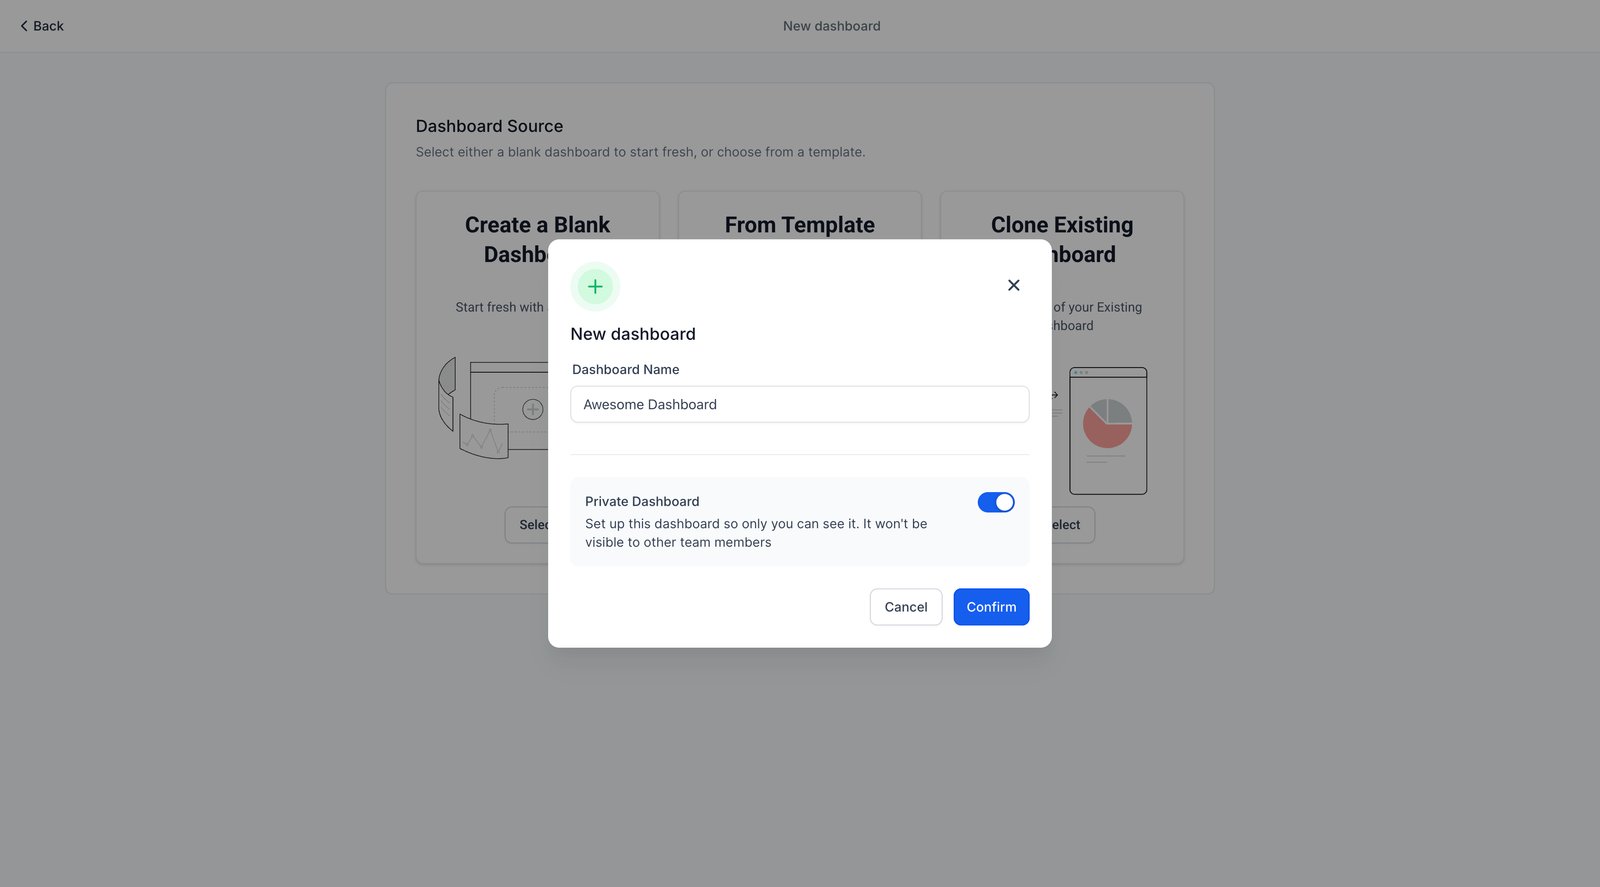
Step 4: Configure Permissions
-
Set up permissions for your dashboard according to your preference. Choose between keeping it private for personal use or sharing it with your entire team.
Step 5: Click “Confirm”
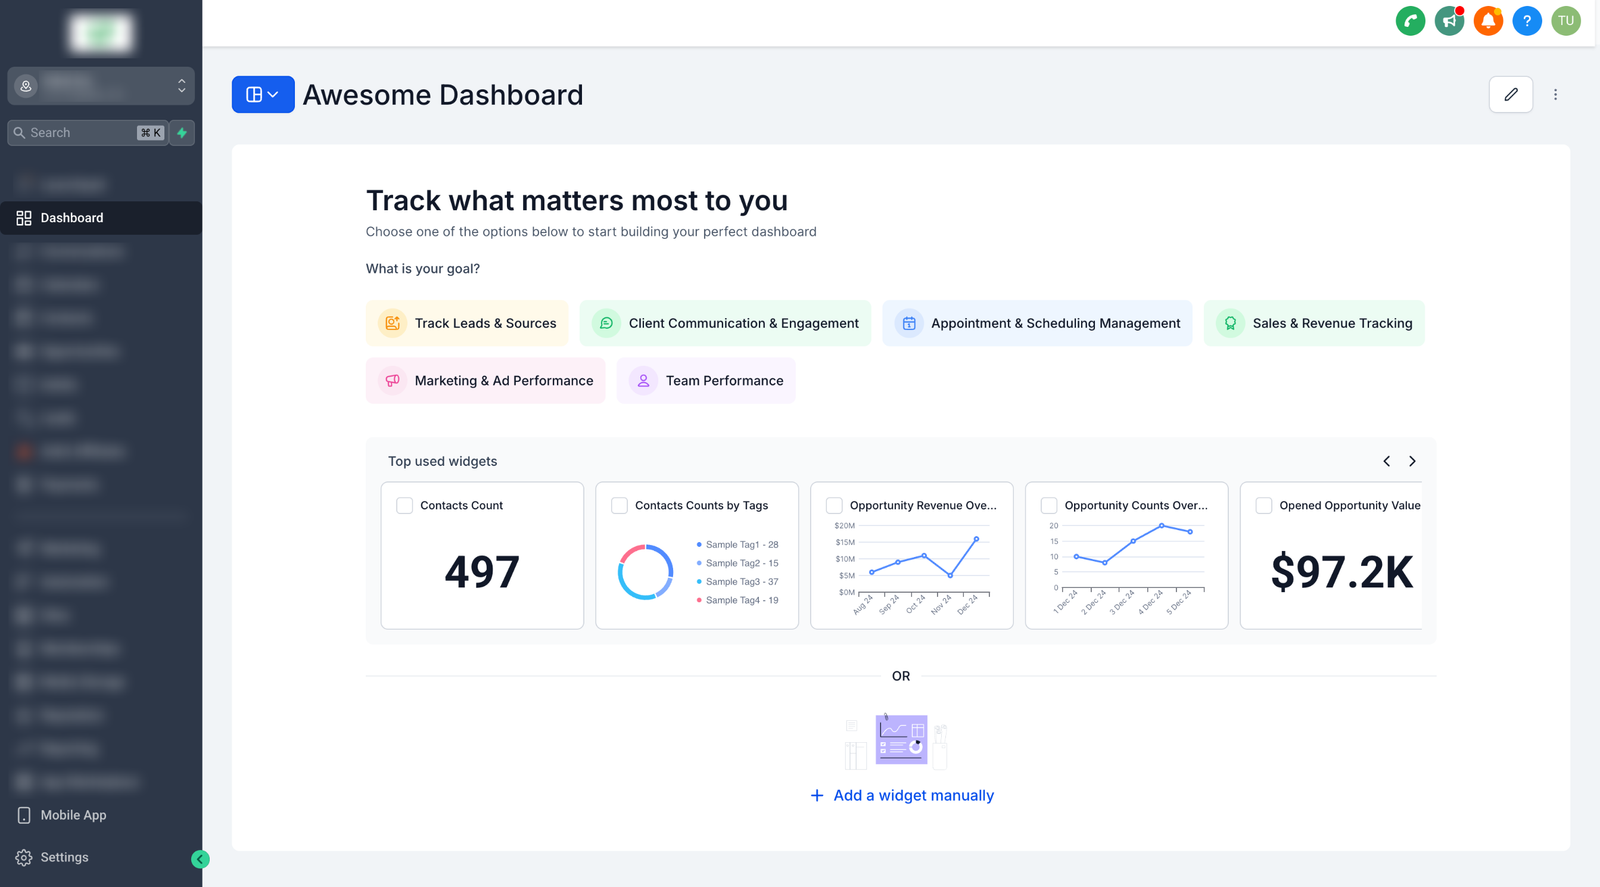
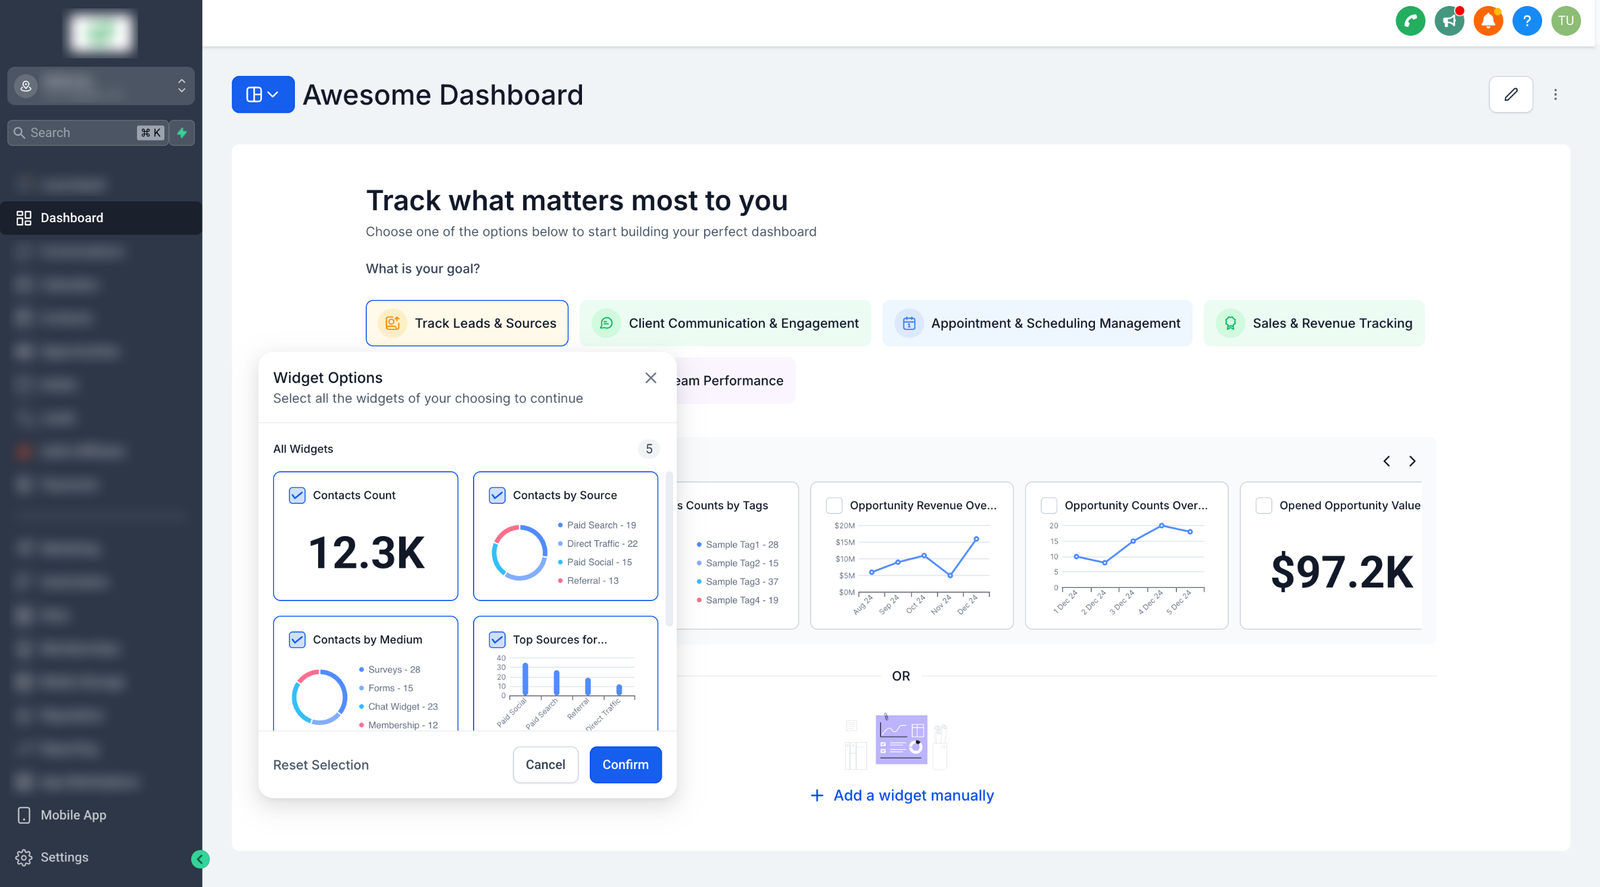
Step 6: Add widgets
-
Choose from a list of predefined goals to instantly add relevant widgets tailored to your tracking needs.
-
Unsure what to track? Quickly select from the most popular widgets used by other users.
-
Combine Options: Select widgets from multiple goals or top-used suggestions to create a comprehensive dashboard in just a few clicks.
-
Manual Widget Addition: Still want full control? You can manually add widgets if needed. Learn more about adding custom widgets
Note:
Custom widgets and reports are available for the $297 plan (One Custom Dashboard) and $497 plan (Unlimited Custom Dashboards)


